CV/Pseudocapacitance Analysis: b-Value Kinetic Analysis
This Workflow uses the output data from Cyclic Voltammetry (CV) Data Extraction and Preprocessing or Cyclic Voltammetry (CV) Data Extraction and Preprocessing to determine the values for both forward (anodic) and reverse (cathodic) scans by power-law fitting of currents at the mid-point potential across different scan rates, used to identify the kinetic control mechanism of electrode reactions.
Prerequisites
First execute Cyclic Voltammetry (CV) Data Extraction and Preprocessing or Cyclic Voltammetry (CV) Data Extraction and Preprocessing to complete CV data extraction. The input folder should contain CV extraction results (Excel files) at multiple different scan rates to ensure statistical significance of the fitting.
Steps
- Select input folder: Use the file picker to select the folder containing the output from Cyclic Voltammetry (CV) Data Extraction and Preprocessing or Cyclic Voltammetry (CV) Data Extraction and Preprocessing with CV data at different scan rates.
- The system automatically extracts mid-point currents, performs fitting calculations, and generates kinetic analysis plots in log-log coordinates.
Scientific Principles
Power Law Relationship
In cyclic voltammetry, the peak current (or current at a specific potential) and scan rate satisfy a power-law relationship:
where is a constant and is the kinetic index. Taking the logarithm of both sides yields the linear form:
Physical Meaning of b-Value
The value is used to identify the rate-controlling step of the electrode process:
| Value | Control Mechanism | Physical Meaning |
|---|---|---|
| Diffusion-controlled | Current limited by reactant diffusion rate in solution | |
| Surface-controlled (capacitive behavior) | Current dominated by surface adsorption/desorption processes | |
| Mixed control | Both diffusion and surface processes contribute |
Mid-Point Potential Selection
This Workflow uses the current value at the mid-point potential of the potential window as the analysis target:
For the last complete cycle in each scan rate file, the absolute current values at for forward and reverse scans are extracted, denoted as (anodic current) and (cathodic current) respectively.
Fitting Method
Least-squares linear fitting is performed in – space to obtain the values and goodness of fit for both anodic and cathodic processes separately.
Output
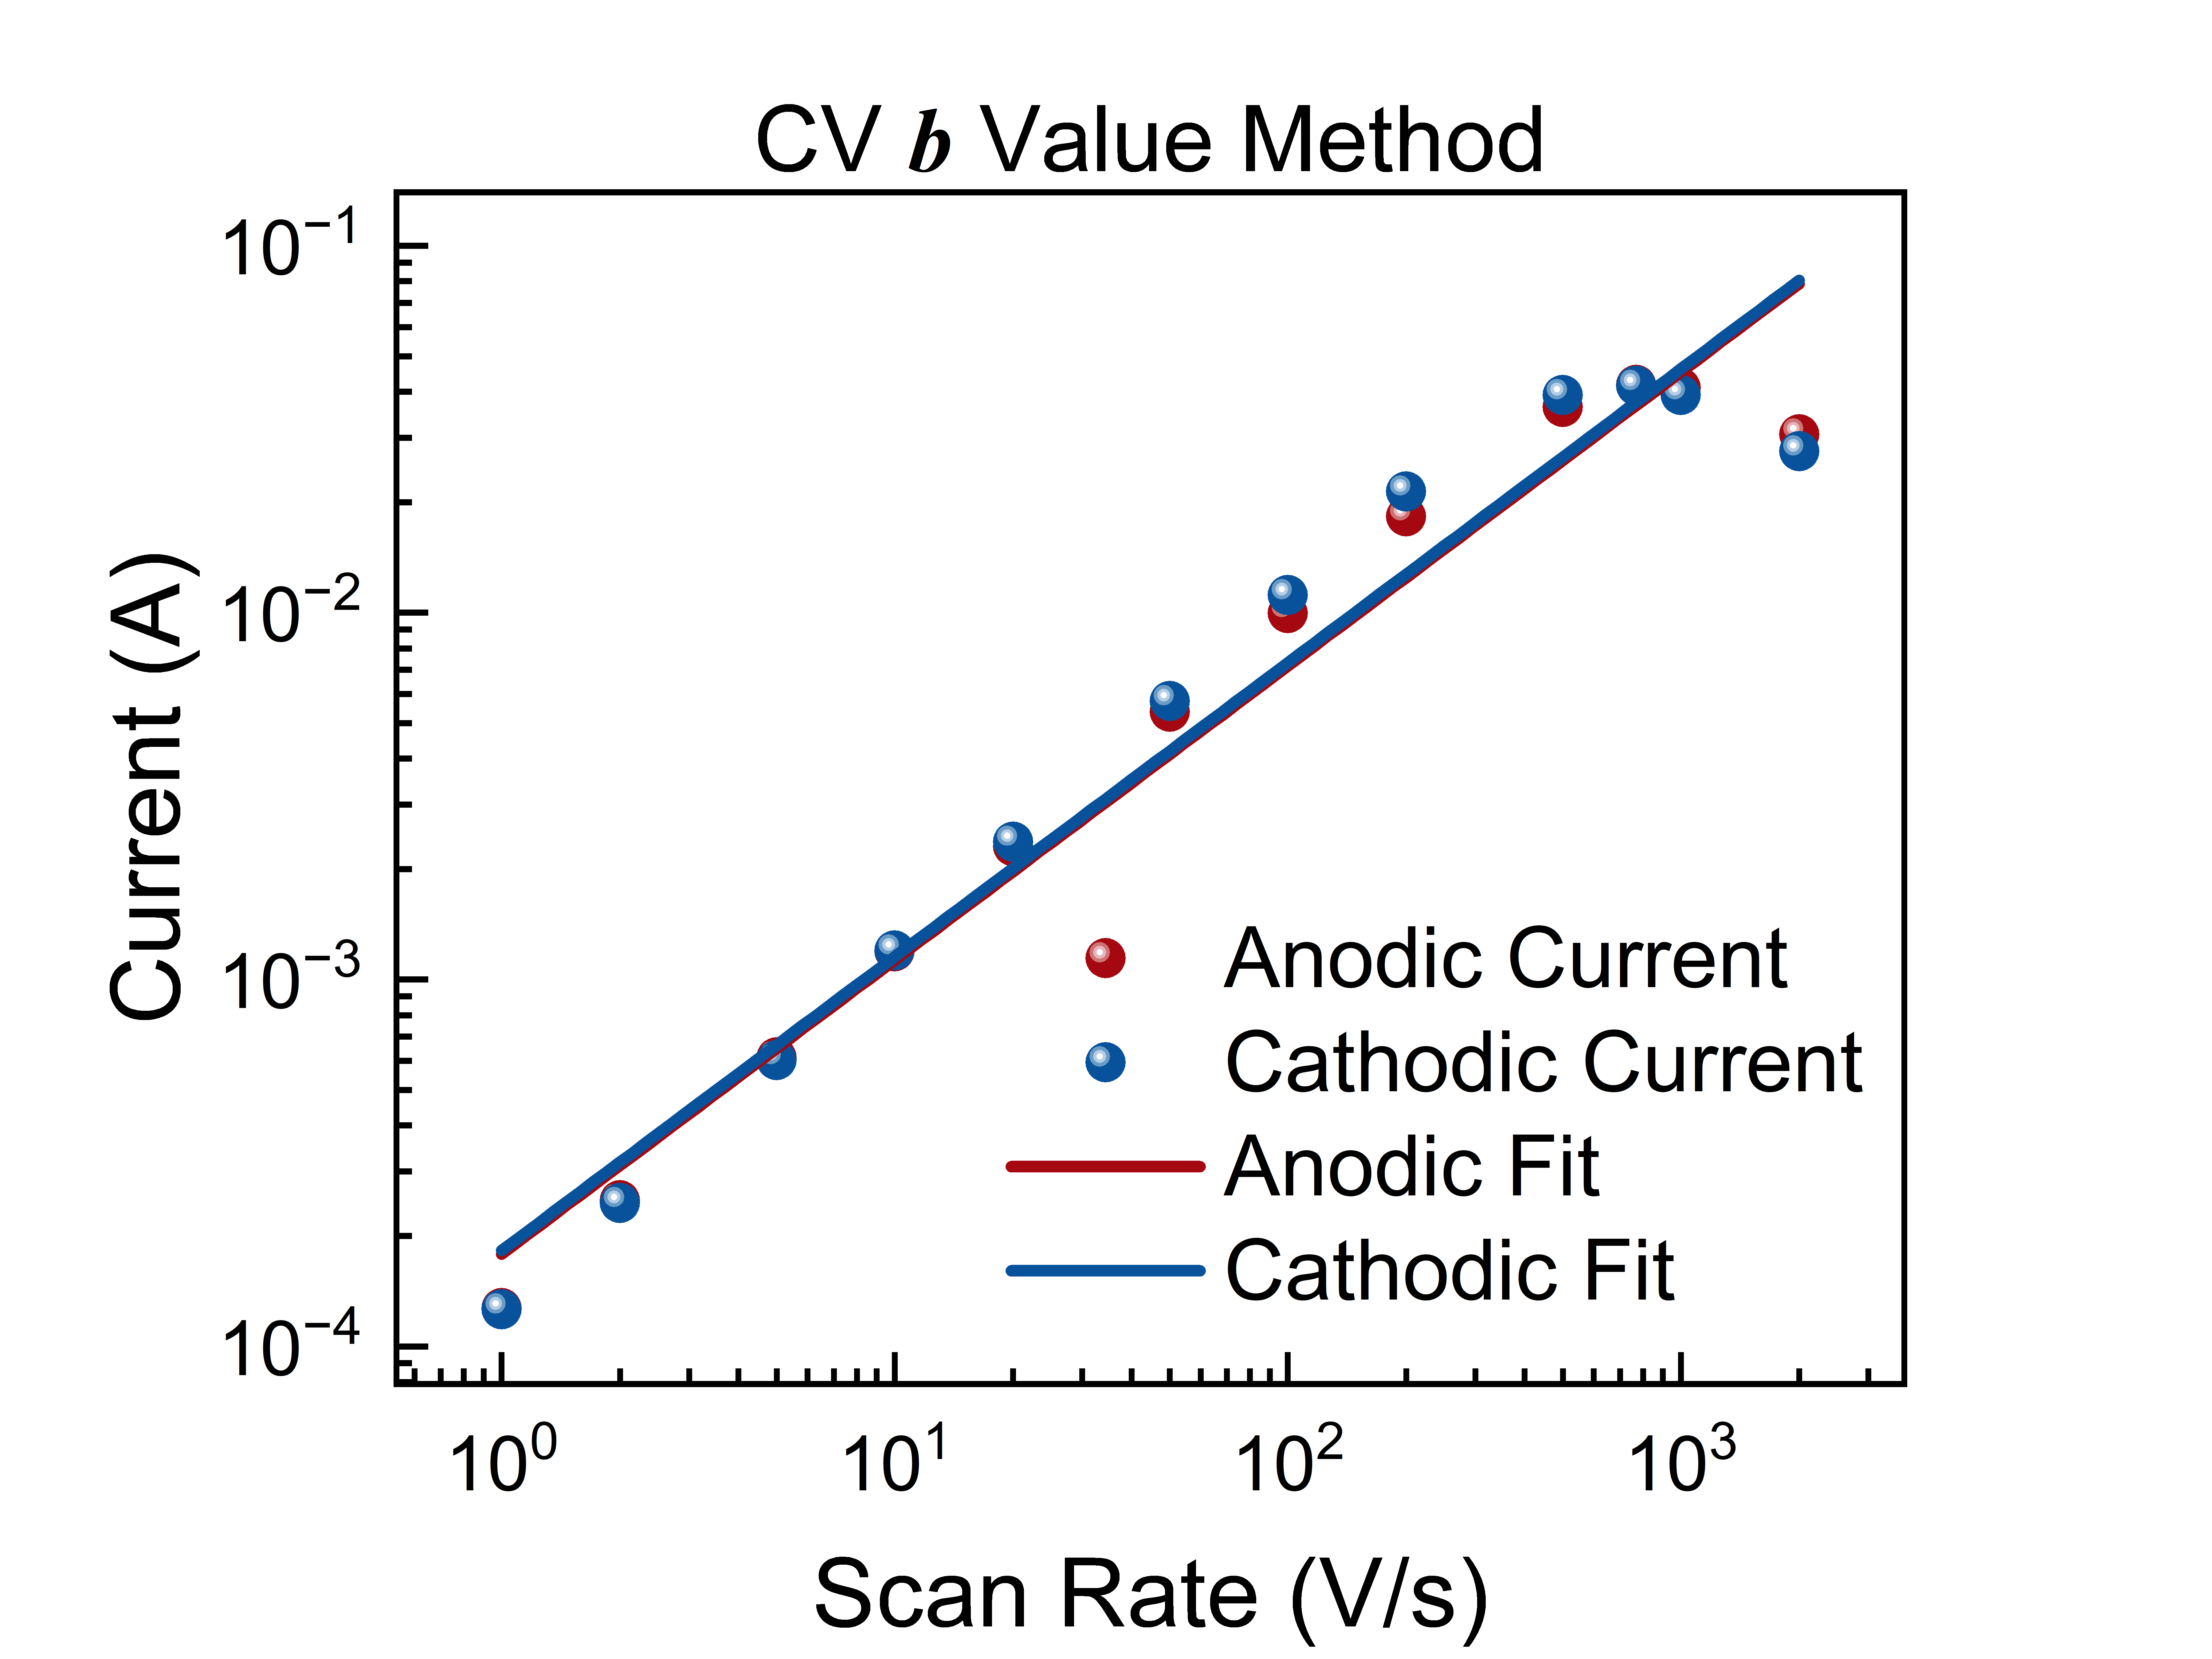
- Log-log scatter plot with fitting curves: x-axis is scan rate (V/s), y-axis is current (A), both on logarithmic scales. The plot includes anodic (red) and cathodic (blue) datasets with their fitting lines, with legends annotating values and .
- Data files: Raw data and fitting curve data are exported as separate CSV files.
Further Analysis
- CV/Cdl: Double-Layer Capacitance and Electrochemically Active Surface Area Analysis: Linear fitting of based on mid-point current differences across scan rates, for calculating electrochemically active surface area (ECSA)
- CV: Coulombic Efficiency and Capacitance Calculation: Evaluating electrode reaction reversibility