CV/Cdl: Double-Layer Capacitance and Electrochemically Active Surface Area Analysis
This Workflow uses the output data from Cyclic Voltammetry (CV) Data Extraction and Preprocessing or Cyclic Voltammetry (CV) Data Extraction and Preprocessing to determine the double-layer capacitance by linear fitting of the difference between anodic and cathodic currents at the mid-point potential across different scan rates. This can be further used to calculate the Electrochemically Active Surface Area (ECSA).
Prerequisites
First execute Cyclic Voltammetry (CV) Data Extraction and Preprocessing or Cyclic Voltammetry (CV) Data Extraction and Preprocessing to complete CV data extraction. The input folder should contain CV extraction results at multiple different scan rates.
Steps
- Select input folder: Use the file picker to select the folder containing the output from Cyclic Voltammetry (CV) Data Extraction and Preprocessing or Cyclic Voltammetry (CV) Data Extraction and Preprocessing with CV data at different scan rates.
- The system automatically calculates the values at each scan rate, performs linear fitting, and generates a fitting plot.
Scientific Principles
Determination of Double-Layer Capacitance
In the non-Faradaic potential region, only double-layer charging and discharging occurs at the electrode surface. The charging current is proportional to the scan rate :
In practice, the average of the absolute values of the anodic current and cathodic current at the mid-point potential is used as the approximate double-layer charging current at that scan rate:
where is defined as:
Linear Fitting
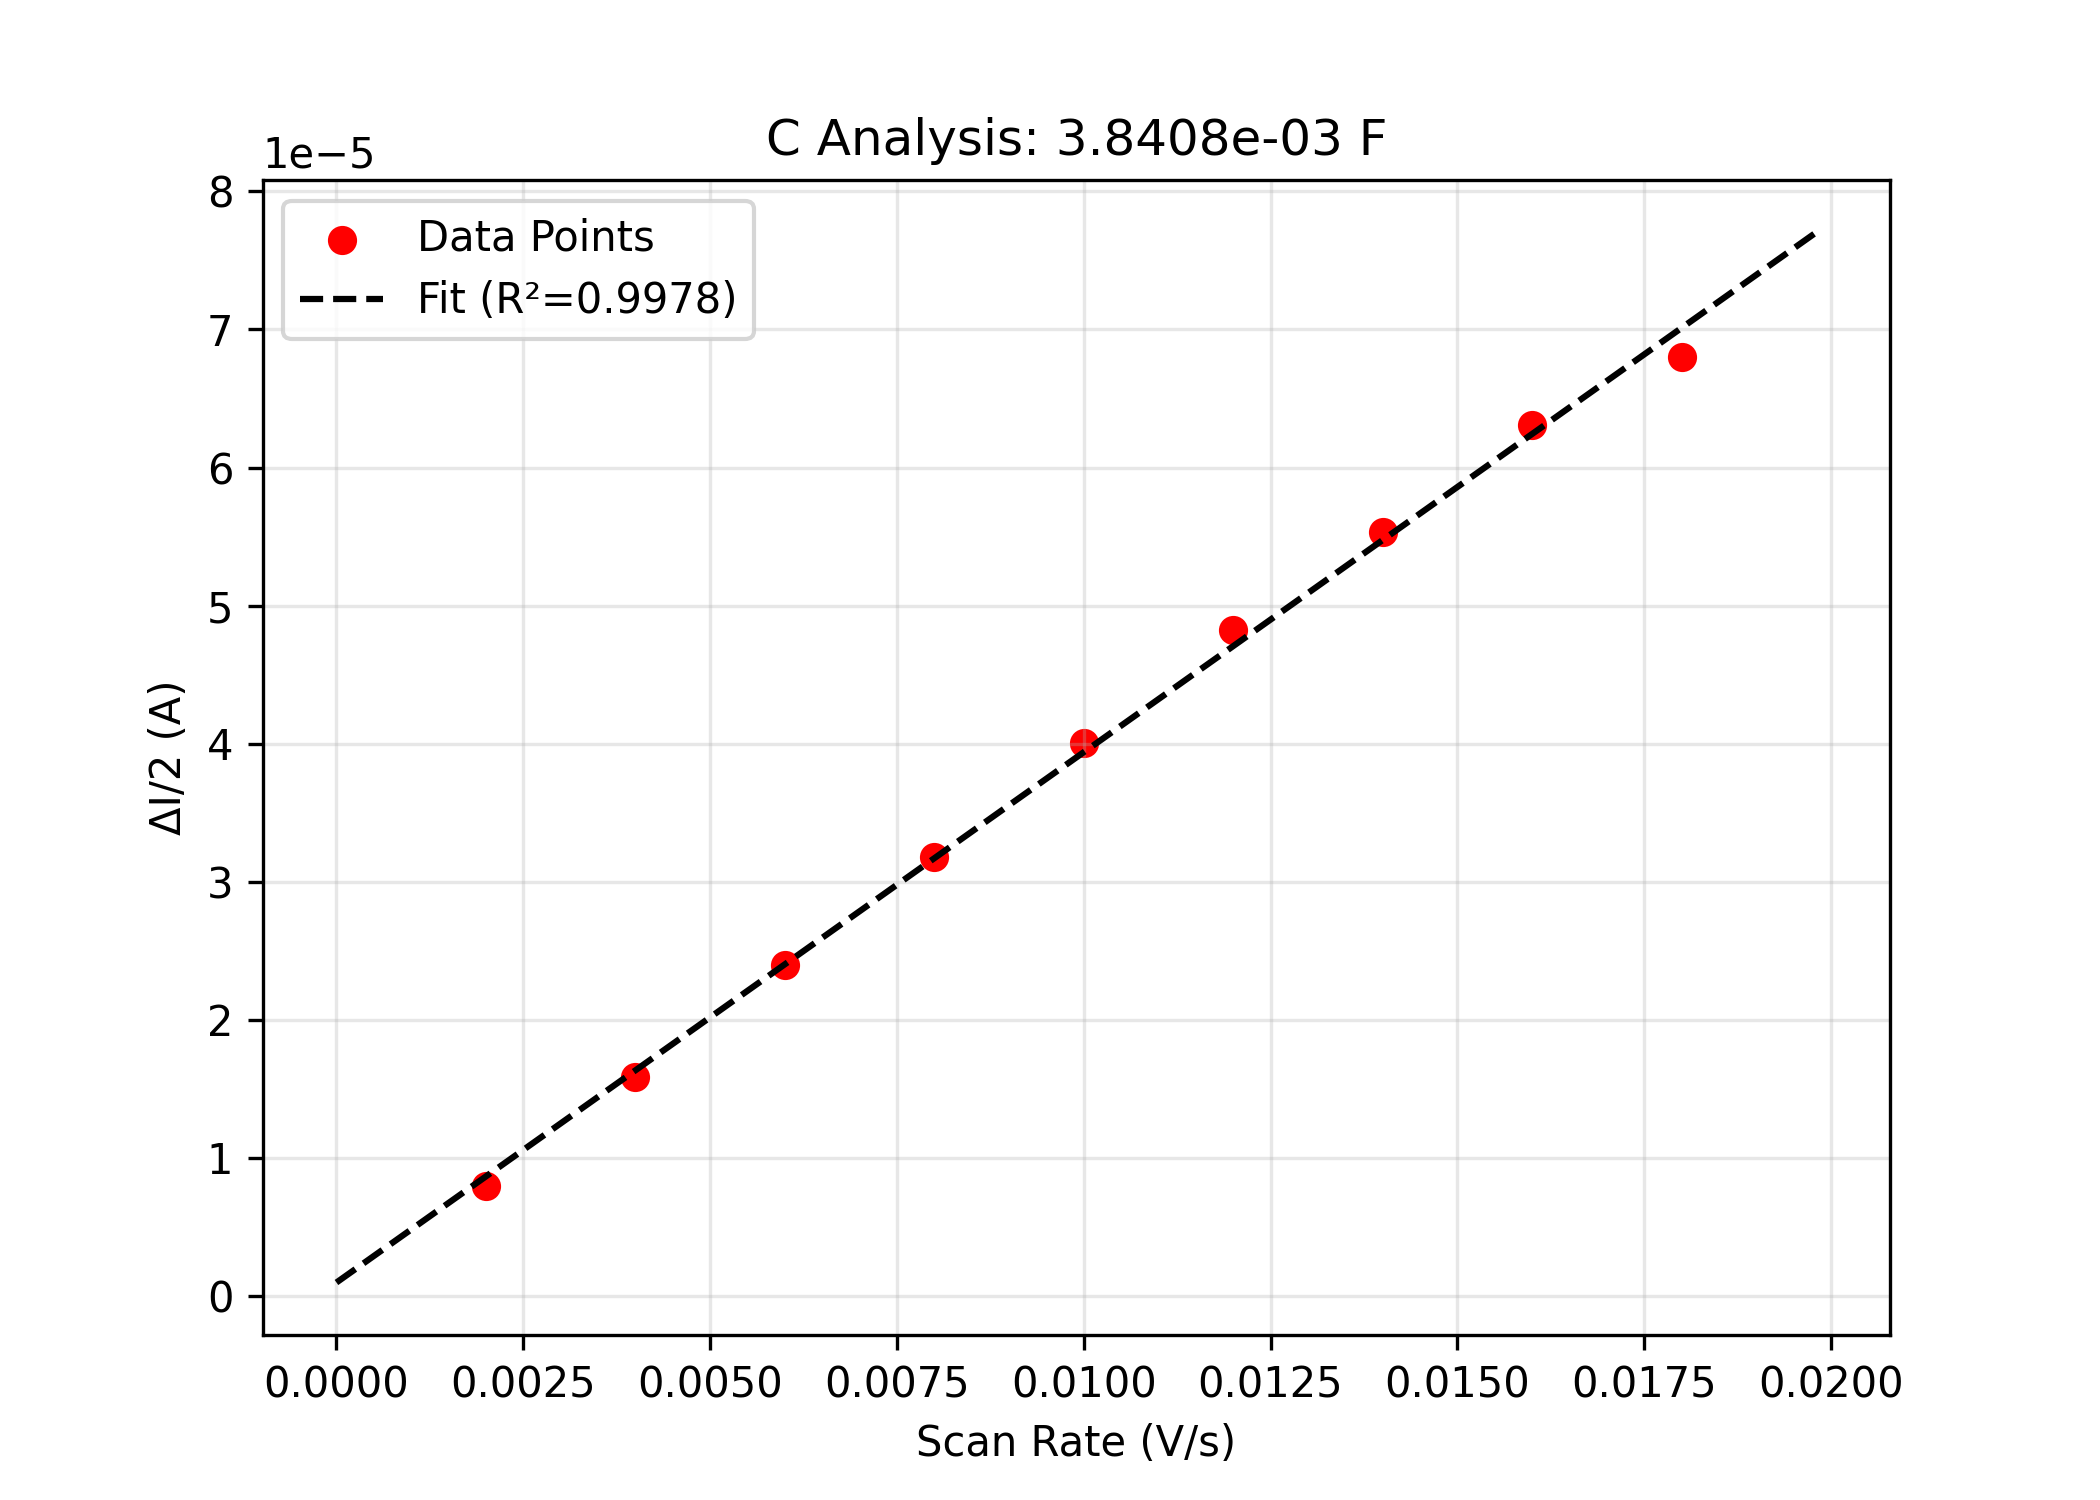
Linear fitting is performed with on the x-axis and on the y-axis:
The fitting slope is the double-layer capacitance (unit: F). Ideally, the intercept should approach zero.
Electrochemically Active Surface Area
Given the specific capacitance (unit: ) of a particular electrode material in a specific electrolyte, ECSA can be calculated as:
Common reference values: the of smooth metal electrode surfaces is typically –.
Output
- Linear fitting plot: x-axis is scan rate (V/s), y-axis is (A). The plot includes experimental data points (scatter) and the least-squares fitting line, annotated with value and .
- Result files are saved to the output folder.
Related Workflows
- CV/Pseudocapacitance Analysis: b-Value Kinetic Analysis: Uses the same mid-point current extraction strategy as this Workflow, but focuses on power-law value kinetic analysis
- CV: Coulombic Efficiency and Capacitance Calculation: Evaluates electrode reaction reversibility from the perspective of charge quantity