GCD: Cycling stability
Identify charge-discharge cycles and report capacity, equivalent capacitance, coulombic efficiency, iR drop, apparent resistance, and cycle period.
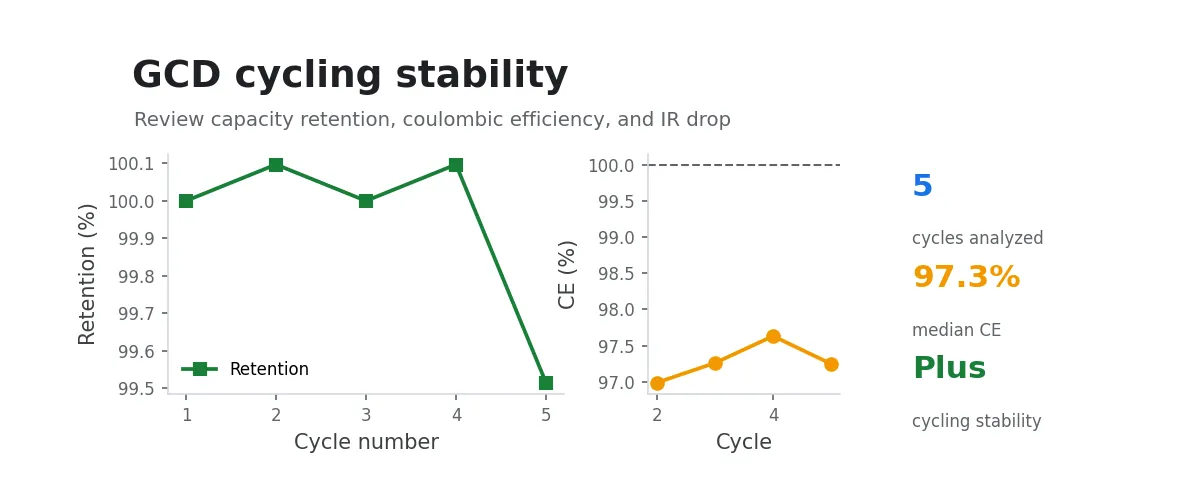
Identify charge-discharge cycles in GCD raw data and report capacity, capacity retention, coulombic efficiency, equivalent capacitance, iR drop, apparent resistance, and cycle period.
Input
Select a group of .txt files or a folder. Each file is processed separately for cycle identification and calculation.
Reading the results
Cycles are numbered from 1 within each file. The workflow identifies charge-discharge cycles from the curve direction and boundaries, and reports pairing details in the status column of the result tables, with details listed below the tables.
Capacity retention uses the first cycle covering the complete discharge voltage range as 100%. Later capacities are shown relative to this baseline. The status column marks missing metrics when a voltage range is incomplete, with details listed below the tables.
Coulombic efficiency is the ratio of discharge capacity to charge capacity for one cycle when both charge and discharge cover the complete voltage range. Charge and discharge equivalent capacitance are calculated from the corresponding charge and potential change. Cycle period is the sum of charge and discharge duration.
iR drop is the potential difference between the pre-reversal voltage peak and the stable discharge trend extrapolated to the reversal time. The stable window skips transition points after reversal, prefers 50 consecutive points, and requires at least 20 points. The stable trend is fitted against actual time and extrapolated to the reversal time. The fit must satisfy and pass checks for the time axis, finite potentials, discharge direction, and voltage-step distinctness.
iR drop and apparent resistance are reported for cycles whose stable segment passes the quality checks. Other cases are marked in the status column, with details listed below the result tables. The iR drop point-selection and fitting plot shows the complete GCD curve, reversal points, complete charge-discharge periods, post-reversal transition points, stable discharge points, the stable trend, and the trend baseline at reversal.
Output
The page displays the file summary, cycle results, and data-quality details. It also provides trend plots for capacity, capacity retention, coulombic efficiency, iR drop, apparent resistance, equivalent capacitance, cycle period, and the raw GCD curves, plus an iR drop point-selection and fitting plot for each input file.
The output directory contains these CSV files for continued plotting in Origin or other software:
gcd_stability_cycle_curves.csv: complete points for every analyzed cycle;gcd_cycle_details.csv: capacity, capacitance, coulombic efficiency, iR drop, apparent resistance, period, and data-quality details for every cycle;gcd_ir_diagnostics.csv: iR point-selection window, stable discharge trend parameters, quality note, iR drop, and apparent resistance;gcd_ir_diagnostic_points.csv: data point indices, time, potential, and stable-trend residuals used by the iR drop point-selection and fitting plots.
The workflow also saves gcd_stability_summary.png/pdf and gcd_ir_diagnostics_<filename>.png/pdf for each input file. The result summary is displayed on the page, and the iR drop point-selection and fitting plots show the point selection and trend.
Origin project
The generated gcd_stability.opju project contains the raw GCD curves and cycle-by-cycle metric plots, with each input file kept as a separate curve.